Research Methodology Survey: A 2026 Academic Guide

TL;DR:
- Survey research methodology involves a systematic process of defining the target population, designing valid questionnaires, collecting data, and analyzing results for accurate inferences. Probability sampling is essential for generalizable findings, while questionnaire clarity and mode of administration significantly impact data quality. Proper error management and analysis procedures ensure reliable, replicable survey outcomes.
Survey research methodology is the systematic process of collecting data from a defined population using standardized questionnaires and probability sampling to produce valid, generalizable statistical inference. It is not simply “sending out a survey.” The discipline covers every decision from population definition and sampling design through questionnaire construction, administration mode, error management, and analysis. Researchers who treat these steps as a unified system, rather than isolated tasks, produce findings that hold up to peer scrutiny. This guide walks through each component with the specificity that academic and professional research demands.
What is research methodology survey design?
A research methodology survey is built on five interlocking components: population definition, sampling, questionnaire development, data collection, and analysis. Miss one, and the others weaken. Survey research involves defining the population, sampling, questionnaire construction, data collection, and analysis with probability sampling for accurate inference. That sequence is not arbitrary. Each stage constrains the next, which is why researchers who skip population definition end up with samples that answer the wrong question.
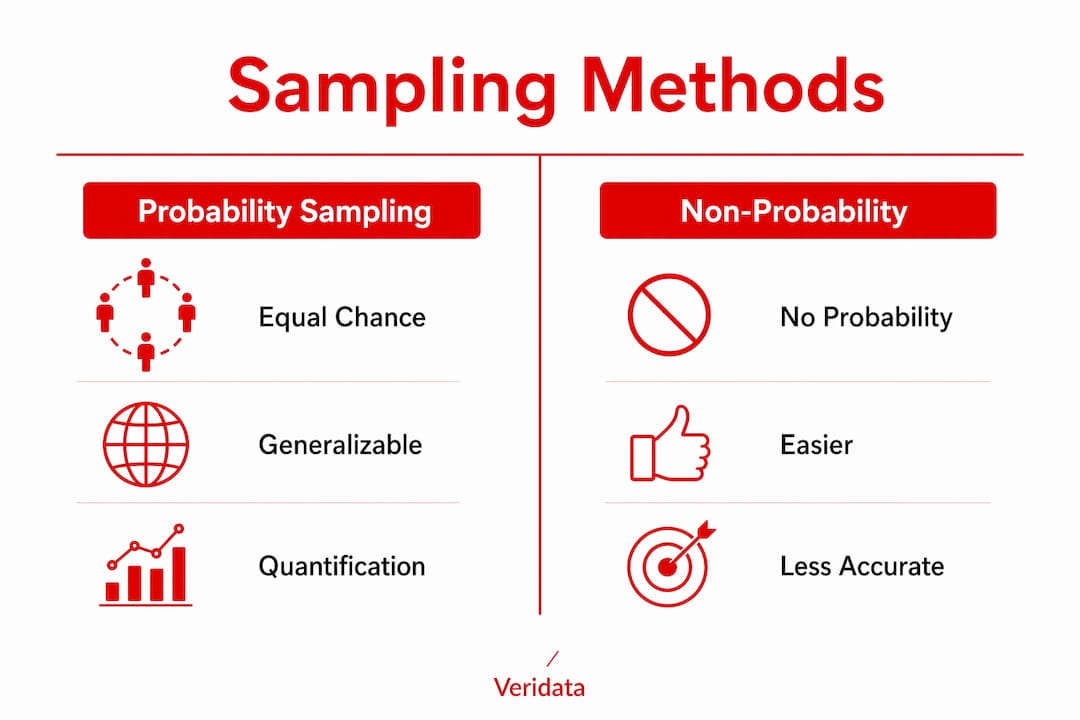
Sampling plans divide into two families: probability and non-probability. Probability sampling assigns every unit in the population a known, non-zero chance of selection. Non-probability sampling does not. The distinction matters enormously because probability samples allow confidence intervals and p-value calculations essential for valid inference. Non-probability approaches, such as convenience or quota sampling, are faster and cheaper but cannot support the same statistical claims.
Questionnaire development sits at the center of the whole enterprise. Standardizing questions is what separates professional survey research from anecdotal data collection. Every question must be worded to minimize ambiguity, avoid leading language, and present exhaustive response options. A single poorly worded item can distort an entire scale.
Survey administration modes in 2026 include online self-completion, telephone interviewing, mail, and in-person interviewing. In-person interviews yield the highest response rates and suit complex or visual material, but at higher cost compared to online or telephone modes. The right mode depends on the population, budget, and the complexity of the questions being asked.

Pro Tip: Before finalizing your sampling plan, write out your analysis plan first. If your planned analysis requires a stratified sample and you collect a simple random sample, you will not be able to run the models you need.
How do sampling methods affect survey quality?
Sampling method is the single biggest determinant of whether your findings can be generalized. The table below compares the five methods researchers use most often.
| Sampling method | Key advantage | Key limitation | Typical use |
|---|---|---|---|
| Simple random | Equal probability, easy to understand | Requires complete sampling frame | National opinion polls |
| Stratified random | Reduces variance, improves subgroup precision | Requires known strata proportions | Health surveys by age group |
| Cluster | Cost-efficient for geographically dispersed populations | Higher design effect, lower precision | School-based studies |
| Multi-stage | Practical for large national studies | Complex weighting required | Government household surveys |
| Non-probability (quota, convenience) | Fast and inexpensive | Cannot support statistical inference | Exploratory or qualitative pilots |
Probability sampling provides the theoretical basis for generalizing from survey samples to target populations with quantifiable uncertainty measures. Without that foundation, every confidence interval you report is technically meaningless. Researchers using non-probability samples in peer-reviewed work must explicitly state this limitation and avoid language that implies population-level generalizability.
Stratified sampling deserves special attention for academic research. By dividing the population into mutually exclusive strata, such as age bands or geographic regions, and sampling within each, researchers reduce sampling variance for subgroup estimates. This is why the U.S. Census Bureau and the European Social Survey both rely on stratified designs rather than simple random sampling.
Cluster sampling introduces a design effect, meaning the effective sample size is smaller than the raw count of respondents. Ignoring this in analysis produces artificially narrow confidence intervals. Multi-stage designs compound this issue, which is why survey-weighted analysis must consider sample design variables like stratification and clustering to avoid standard error underestimation.
Pro Tip: Always calculate your design effect before reporting results from a cluster or multi-stage sample. Software packages like the R survey package and Stata’s svy suite handle this automatically, but only if you supply the correct design variables.
What makes questionnaire design and administration effective?
Question design is where most surveys quietly fail. Question wording critically affects response distributions, and neutral, simple, exhaustive options produce more reliable data. Four principles govern good question design:
- Simplicity: Use plain language. If a 12-year-old cannot understand the question, rewrite it.
- Neutrality: Avoid loaded terms, presuppositions, and leading phrasing. “How satisfied are you?” is neutral. “How satisfied are you with our excellent service?” is not.
- Exhaustiveness: Response options must cover all plausible answers. An “Other (please specify)” option is not a substitute for thorough option development.
- Mutual exclusivity: No respondent should be able to select two options that mean the same thing.
Closed-ended questions, such as Likert scales, multiple choice, and ranking items, are the backbone of quantitative survey research. Open-ended questions add texture and are valuable in mixed methods surveys, but they require coding and are harder to analyze at scale. Tools like Qualtrics and SurveyMonkey support both formats and include skip logic, display logic, and randomization features that reduce order effects.
Choosing the right administration mode follows from your population and research question. Here is a practical decision sequence:
- Identify your population’s accessibility. Online panels work for general consumer populations. Telephone interviewing reaches older adults and those without internet access. In-person methods are necessary for populations with low literacy or complex visual tasks.
- Assess your budget. Online surveys cost a fraction of in-person fieldwork. If budget is tight, online or mixed-mode is the practical choice.
- Consider response rate targets. Mixed-mode surveys are increasingly preferred over single-mode designs due to declining response rates and improving data representativeness. A phone-first, online-follow-up design often outperforms either mode alone.
- Match mode to question complexity. Conjoint analysis and concept testing with images require online or in-person delivery. Simple attitude scales work in any mode.
For reliable questionnaire construction, the order of questions matters as much as the wording. General questions should precede specific ones. Sensitive questions belong near the end, after rapport is established. Demographic items typically close the survey.
How do you manage survey errors and analyze data correctly?
Total Survey Error (TSE) is the framework researchers use to categorize and manage every source of inaccuracy in a survey. Survey error management involves numerous decisions to optimize accuracy within budget and timing constraints. TSE covers two broad categories: errors of representation (who is in your sample) and errors of measurement (how accurately respondents answer).
Common error sources and mitigation strategies include:
- Coverage error: The sampling frame excludes part of the target population. Mitigation: use multiple frames or weight by known population benchmarks.
- Sampling error: Random variation from selecting a sample rather than a census. Mitigation: increase sample size or use stratification.
- Nonresponse error: Respondents differ systematically from non-respondents. Mitigation: maximize response rates, conduct nonresponse follow-up, and apply nonresponse weights.
- Measurement error: Questions produce inaccurate answers. Mitigation: rigorous question design and pre-testing and pilot surveys to identify and reduce systematic questionnaire errors before full deployment.
Once data is collected, analysis must account for the sample design. Researchers who run standard regression on a complex sample without specifying design variables underestimate standard errors and overstate statistical significance. The R survey package, Stata’s svy commands, and SAS PROC SURVEYREG all handle weighted, clustered, and stratified designs correctly.
Weighting adjusts for unequal selection probabilities and nonresponse. Post-stratification weighting aligns the sample to known population totals on key variables such as age, gender, and education. This step is not optional in probability-based research. It is what makes the sample representative.
When should you use survey research vs. other methods?
Survey research is appropriate for describing variable distributions and associations but less suitable for causal inference or studying rare populations. Choosing the right method before you design anything saves months of wasted effort.
Surveys excel when you need to measure attitudes, behaviors, or characteristics across a large population at a single point in time or across time in a panel design. Social sciences use surveys to track political opinion, health sciences use them to measure patient-reported outcomes, and business researchers use them to assess customer satisfaction and market segmentation. The General Social Survey, the European Social Survey, and the Behavioral Risk Factor Surveillance System are all examples of large-scale survey programs that have generated decades of comparable data.
Surveys are the wrong tool when you need to establish causation. A randomized controlled experiment, not a survey, is the appropriate design for causal questions. Surveys are also poorly suited to studying rare populations, such as individuals with a specific rare disease, because probability sampling from the general population will yield too few cases for meaningful analysis. Targeted recruitment or registry-based sampling is more appropriate in those contexts.
Survey methodology is evolving into a more scientifically structured discipline with increased attention to cross-national and mixed-mode designs. Longitudinal and panel surveys are growing in importance as researchers seek to track change over time rather than capture a single snapshot. Adaptive survey designs, which adjust data collection procedures in real time based on interim response patterns, are moving from experimental to mainstream practice.
For researchers working across disciplines, academic standards require detailed methods reporting describing population, sampling, survey mode, and analytic strategy for clarity and reproducibility. A methods section that says only “we surveyed 500 participants online” fails this standard completely.
Key takeaways
Survey methodology produces valid, generalizable findings only when sampling, questionnaire design, administration mode, error management, and analysis are treated as a single integrated system rather than separate tasks.
| Point | Details |
|---|---|
| Probability sampling is non-negotiable | Only probability samples support confidence intervals and valid statistical inference. |
| TSE guides quality decisions | Managing coverage, sampling, nonresponse, and measurement error is the core of rigorous survey design. |
| Mode choice shapes data quality | Mixed-mode designs outperform single-mode in response rates and population representation. |
| Question wording determines reliability | Neutral, simple, exhaustive questions produce data you can actually trust and publish. |
| Analysis must match sample design | Ignoring stratification and clustering in analysis produces misleading standard errors. |
Why I think most researchers underestimate survey methodology
I have reviewed a lot of methods sections over the years, and the pattern is consistent. Researchers spend enormous energy on their theoretical framework and almost none on their sampling plan. They describe their questionnaire instrument in detail but say nothing about how they handled nonresponse or weighted their data. Then they wonder why reviewers push back.
The uncomfortable truth is that “I used a survey” is not a methods section. It is a placeholder. A real methods section, as the Methodology Hub makes clear, must explicitly describe sampling procedures, mode of survey, question justification, and a full data analysis plan. Not just the instrument.
The rise of internet and mobile data collection has made this worse, not better. Changing respondent behaviors demand upfront rigorous evaluation and pilot testing, yet many researchers skip piloting entirely because they feel time-pressured. That shortcut costs them in data quality every time.
My prediction for post-2026 survey research: adaptive designs and passive data integration will become standard, but the researchers who thrive will be the ones who understand the underlying methodology well enough to know when to trust the algorithm and when to override it. Methodology literacy is not going away. It is becoming more important.
— Daniel
How Veridata Insights supports rigorous survey research
Whether you are designing a longitudinal academic study or a one-time market research project, Veridata Insights handles every stage of the process. From survey design and sampling through programming, data collection, weighting, and reporting, the team brings the methodology expertise your research deserves. Veridata Insights specializes in B2B, B2C, healthcare, and hard-to-reach audiences, with no project minimums and support available seven days a week. If managing total survey error and maximizing data quality sounds like exactly what your next study needs, reach out for a consultation and put the right methodology behind your research from day one.
FAQ
What is survey research methodology?
Survey research methodology is the systematic process of defining a target population, selecting a sample, designing standardized questions, collecting data, and analyzing results to produce valid statistical inference. It is the structured framework that separates rigorous research from informal data gathering.
What is the difference between probability and non-probability sampling?
Probability sampling gives every unit in the population a known chance of selection, which allows researchers to calculate confidence intervals and p-values. Non-probability sampling lacks this property and cannot support population-level generalization.
Why are mixed-mode surveys preferred in 2026?
Mixed-mode surveys combine online, telephone, and in-person methods to counteract declining single-mode response rates and improve the representativeness of the final sample. The SAGE Handbook of Survey Methodology identifies this shift as one of the defining trends in modern survey practice.
What is Total Survey Error?
Total Survey Error is a framework that categorizes all sources of inaccuracy in a survey, including coverage, sampling, nonresponse, and measurement errors. Researchers use it to make design decisions that balance data quality against cost and time constraints.
How should survey data be analyzed to avoid errors?
Survey data from complex designs must be analyzed using software that accounts for stratification, clustering, and weighting, such as the R survey package or Stata’s svy commands. Running standard regression on weighted data without specifying design variables underestimates standard errors and inflates statistical significance.


Comments
Post a Comment